MLB Umpire Statistics: Strike Zone Impact on Betting
 Available in US
Factoring Umpire Strike Zone Data into Game Totals
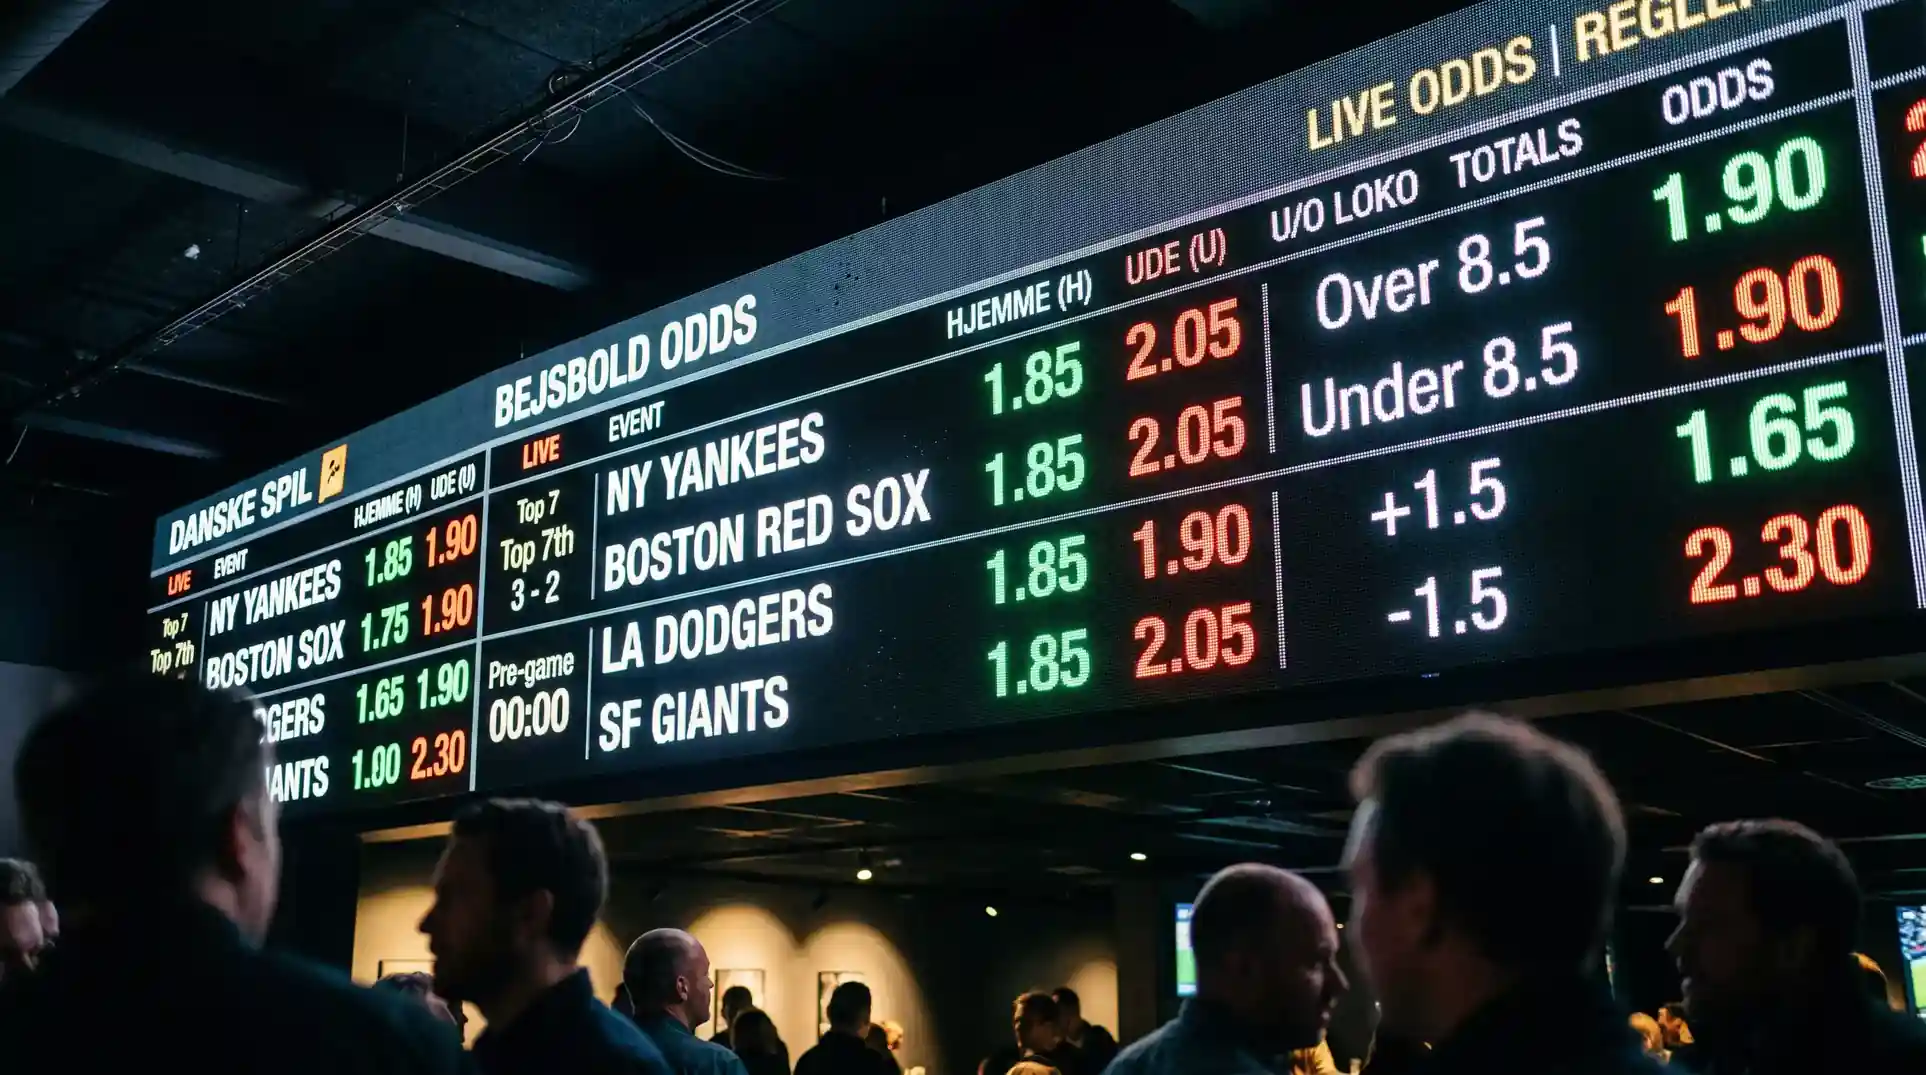
Last May I had two identical-looking totals plays on the same night. Same calibre of starters, similar offensive matchups, both games priced at 8.5. I bet the under on one and the over on the other. The difference? The umpires. One had a strike zone the size of a dinner table – he called everything on the edges, suppressing offence and speeding up the game. The other squeezed the zone tight, forcing pitchers to throw meatballs down the middle. The under cashed at 4-2; the over hit at 11-7. Same analysis, different umpires, opposite outcomes.
All 30 MLB organisations track umpire tendencies in their preparation for every game, yet the betting public almost never checks who is calling balls and strikes. That asymmetry is where value lives. The home plate umpire is the one variable that changes every single game and that directly influences both totals and pitcher props in measurable, repeatable ways.
Umpire Strike Zone Variation and Its Effect on Totals
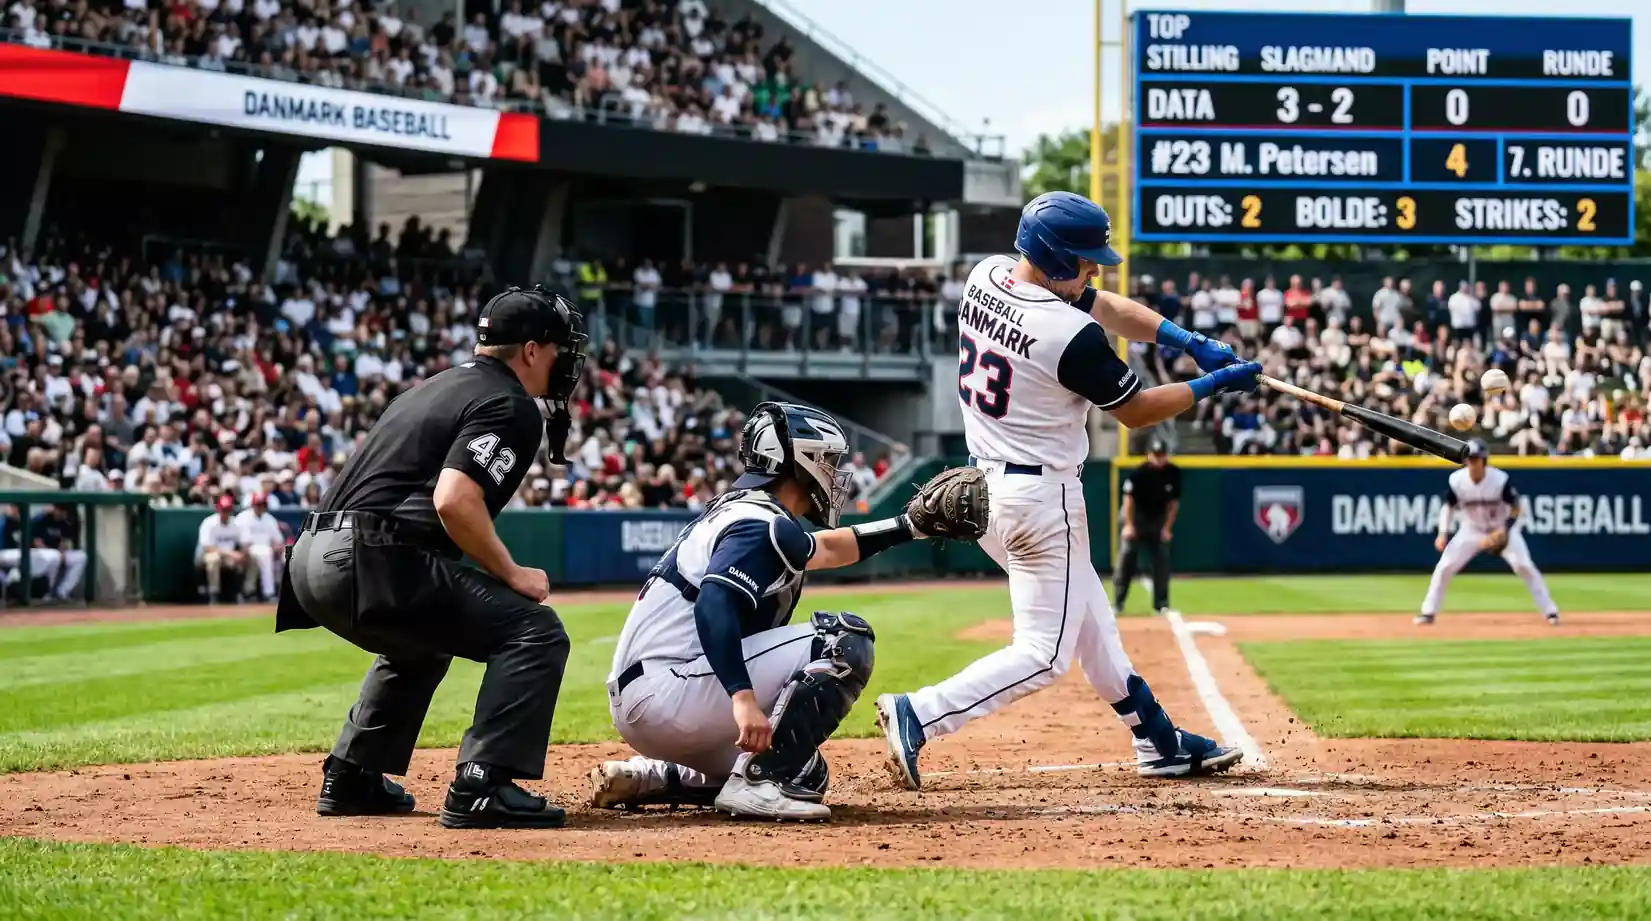
Gerrit Cole’s 39.9% strikeout rate in 2019 was built partly on the quality of his stuff and partly on the strike zone he worked within on any given night. Umpires are human, and their zones vary significantly. Some call a generous zone that extends an inch or two off the plate; others enforce a tight zone that barely covers the rulebook dimensions. The difference between the two can swing a game total by a full run or more.
I categorise umpires into three groups based on their career over/under tendencies. The first group – roughly a third of the active roster – consistently works games that trend over. These umpires call tight zones, issue more walks, and create higher pitch counts that lead to earlier bullpen usage. Their games average approximately 0.4 to 0.6 runs above the league-average total.
The second group trends under. These umpires call generous zones, generate more called strikes, and allow pitchers to work efficiently through lineups. Their games average 0.3 to 0.5 runs below the league-average total. The third group is neutral – their zones are close enough to average that the umpire effect is negligible.
The practical application is a simple overlay. After I have set my totals projection based on pitching, offence, park, and weather, I check the umpire assignment and apply a modifier. For a strong over-trending umpire, I bump my projection up by 0.4 runs. For a strong under umpire, I subtract 0.4. This single adjustment has flipped the value side of a totals play in roughly 15% of games – not a massive frequency, but enough to add meaningful seasonal returns.
How Umpire Tendencies Shift Pitcher Prop Lines
Umpire impact on pitcher props – particularly strikeout totals – is even more direct than on game totals. A pitcher’s ability to generate called strike threes depends partly on his pitch execution and partly on whether the umpire is willing to ring up hitters on borderline pitches. A generous umpire who calls strikes on pitches an inch off the plate inflates the called-strike rate, which cascades into more strikeout opportunities.
I track each umpire’s called-strike rate above expected (CSW above average) and cross-reference it with the scheduled starter’s reliance on called thirds. A pitcher who generates 30% of his strikeouts on called third strikes benefits enormously from a generous umpire. His K-prop over becomes more attractive, even if the matchup against the opposing lineup looks average. Conversely, a pitcher who generates most of his strikeouts via swinging strikes is less affected by the umpire’s zone – his prop line should be evaluated primarily through matchup data rather than umpire tendencies.
The intersection of umpire zone and pitcher type creates a two-by-two matrix that I use as a quick filter. Generous umpire plus called-strike pitcher: lean over on the K prop. Tight umpire plus called-strike pitcher: lean under. Generous umpire plus swing-and-miss pitcher: neutral. Tight umpire plus swing-and-miss pitcher: slight lean under, because the tighter zone forces the pitcher into the zone and may produce more contact. It takes 30 seconds to check, and it refines my prop assessment in a way that the raw numbers alone cannot.
Where to Find Reliable Umpire Data for Pre-Game Research
Umpire assignments are announced the morning of each game, which means the research window is tight. I check assignments as soon as they are published – typically by noon Eastern time – and cross-reference against my umpire database. Several free resources compile umpire statistics including career over/under records, average runs per game, and called-strike rates. The data is updated in real time during the season and requires no subscription to access.
Building your own umpire database takes about two hours at the start of the season and 10 minutes per week to maintain. I keep a spreadsheet with four columns for each umpire: name, career over/under record, average total runs per game, and called-strike rate versus league average. Any umpire whose runs-per-game figure deviates from the league average by 0.3 or more gets flagged as an active modifier. That flag triggers an automatic check when he appears on the day’s schedule.
The limitation of umpire data is sample size within a single season. Each umpire works roughly 120 to 130 games per year behind the plate, but a given starter might face a specific umpire only two or three times. The career data is more reliable than the current-year data for individual matchup projections, which is why I use career averages as the baseline and current-year figures as a secondary confirmation.
For a broader look at how umpire tendencies interact with pitcher metrics, park factors, and lineup splits to shape prop and totals outcomes, the player props statistics guide integrates umpire analysis into the full pre-game framework.
Umpire Statistics FAQ
How much can the home plate umpire swing an MLB game total?
The most extreme umpires push game totals approximately 0.5 to 0.7 runs above or below the league average. That swing is enough to flip the value side of a totals bet in roughly 10% to 15% of games. The effect is strongest when a generous or tight umpire is paired with pitchers whose styles amplify the zone tendency – for instance, a tight-zone umpire behind the plate for a called-strike-dependent pitcher produces a measurable decrease in strikeouts and a corresponding shift in scoring expectations.
Where can bettors find umpire assignment data before MLB games?
Umpire assignments are published on the morning of each game, typically by noon Eastern time. Several free websites and social media accounts compile daily assignments alongside career statistics including over/under records and average runs per game. The data requires no subscription and can be integrated into a pre-game research routine in under five minutes. I recommend building a personal umpire database at the start of each season to speed up the daily check.
Published by the mlb Betting Statistics team.