MLB Betting Trends: ATS Records, Totals Patterns, and Underdog Profitability

Table of Contents
- Trends Alone Don’t Win — but These Come Close
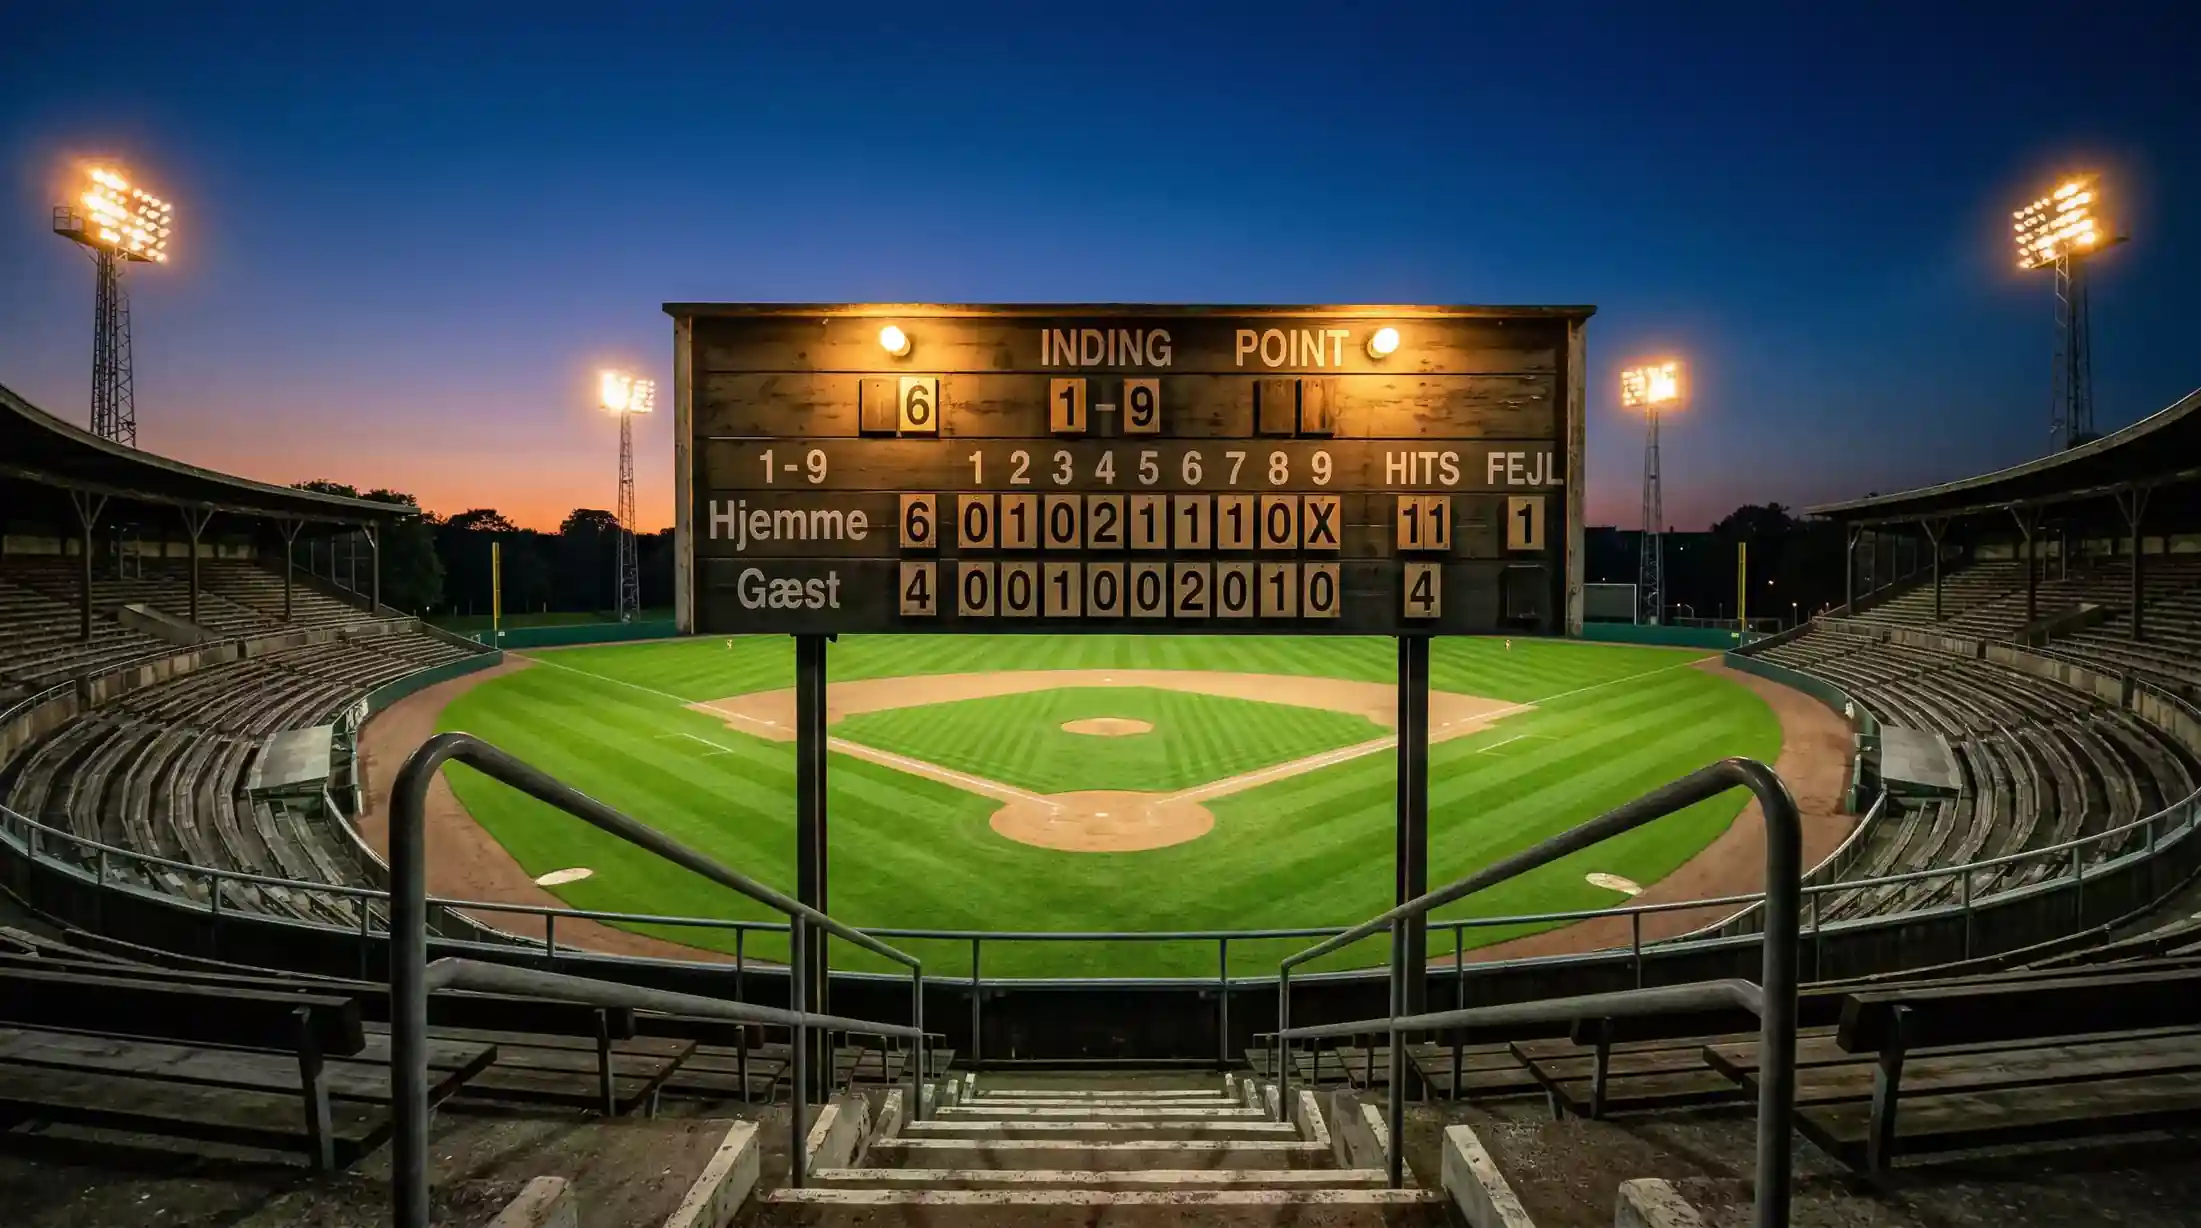
- ATS Standings: Which MLB Teams Cover Consistently
- Over/Under Trends by Division and Ballpark
- Home Underdog Win Rates and ROI Breakdown
- Mid-Season and September Stretch: When Trends Gain Predictive Power
- Separating Signal from Noise in MLB Trends
- MLB Betting Trends FAQ
Trends Alone Don’t Win — but These Come Close
Last September, a mate sent me a screenshot: “Padres have gone OVER in 11 of their last 13 games, smash the over tonight?” I looked at the matchup — two elite starters, wind blowing in at Petco Park, a total already set half a run above the season average. The trend said over. Every other variable said under. I took the under. It cashed by three runs.
Trends are the most misused data point in baseball betting. They’re everywhere: broadcast graphics, betting apps, social media tipsters screaming about 9-1 ATS runs. And they’re not useless — far from it. But a trend without context is just a pattern looking for a story. The trends that actually move the needle are the ones grounded in a structural cause, backed by a meaningful sample, and confirmed by what the underlying statistics say about why the pattern exists.
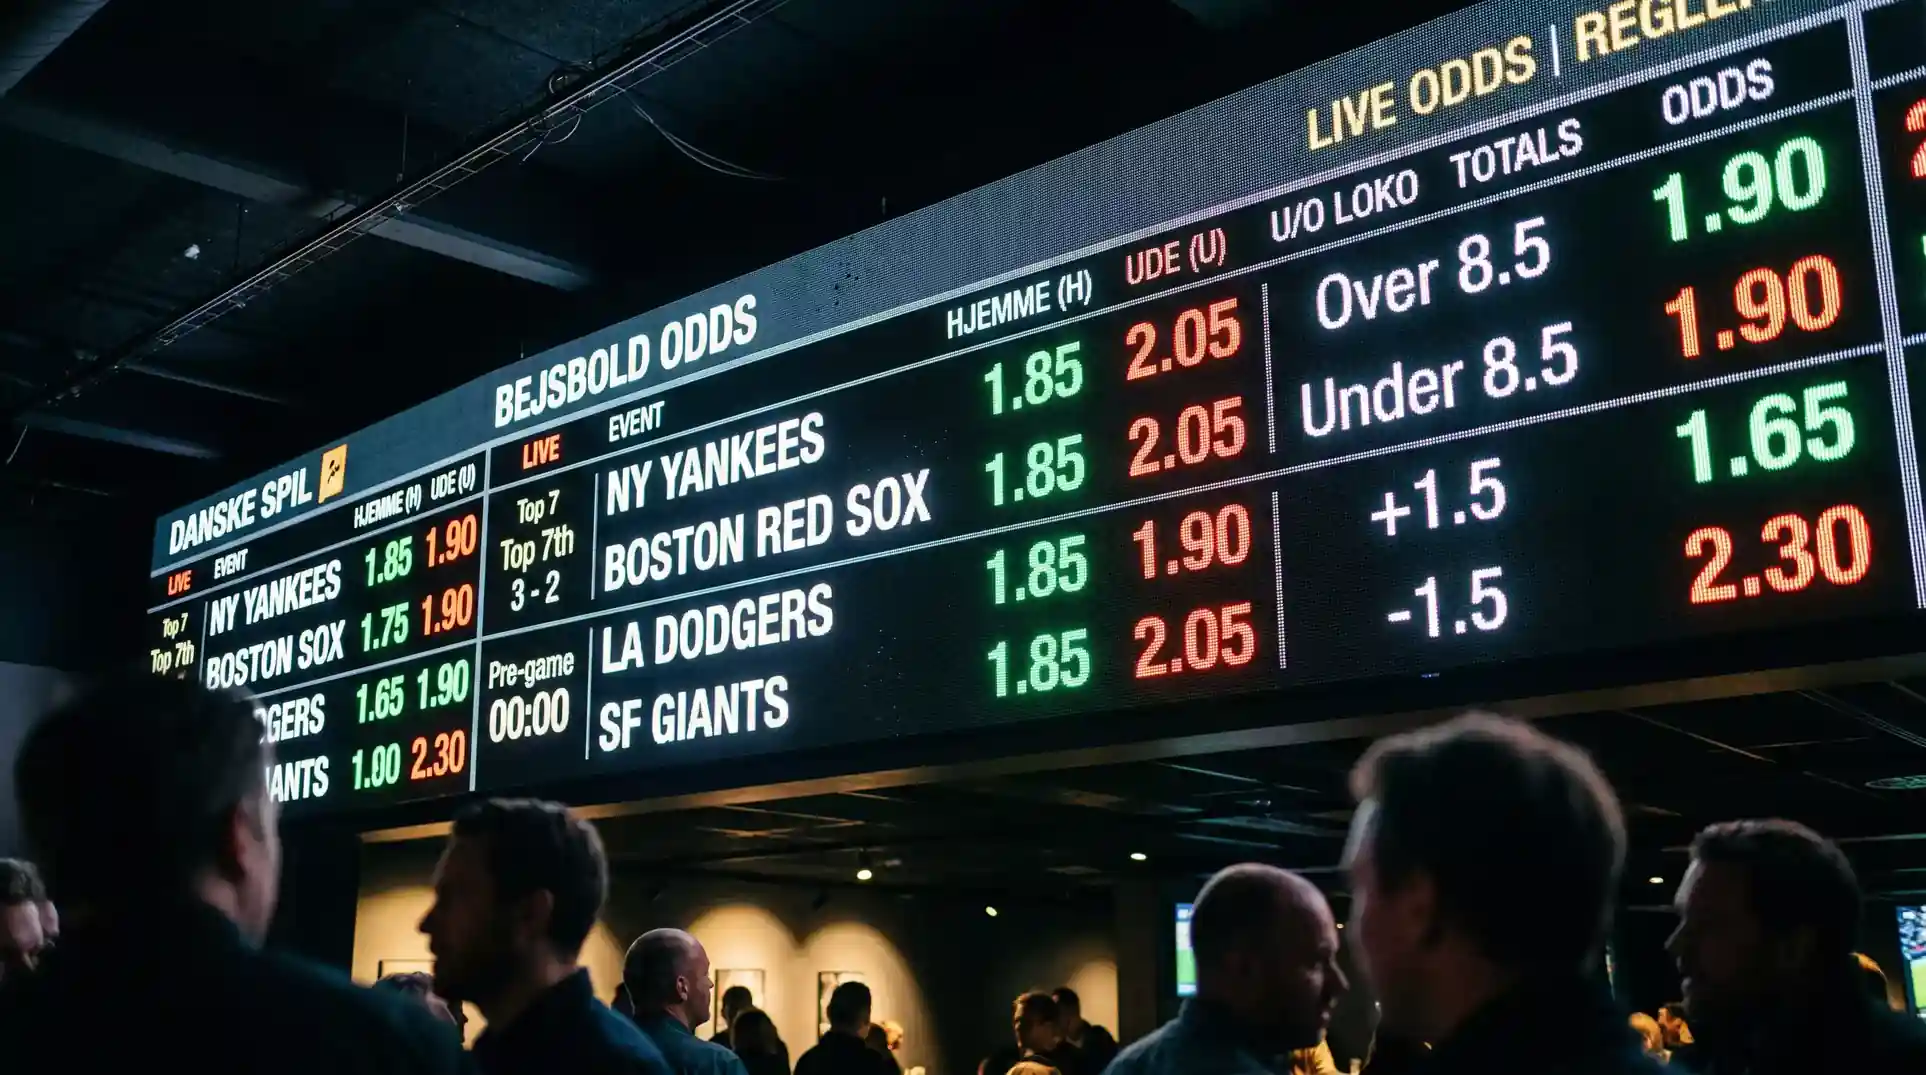
MLB favourites take the moneyline roughly 58% to 62% of the time across a full season. That number is stable enough to serve as a baseline, but it hides enormous variance at the team level, the divisional level, and across different phases of the 162-game marathon. This guide breaks down the trends that persist — ATS records, totals patterns, underdog profitability — and the ones that collapse under scrutiny. If you’ve been chasing trends blindly, this is where that stops. If you’ve been ignoring them entirely, you’re leaving edge on the table.
For the complete statistical framework behind these numbers, including MLB betting statistics across every major market, the pillar guide provides the full landscape. Here, we go trend by trend and test which ones deserve your attention.
ATS Standings: Which MLB Teams Cover Consistently
Against-the-spread records in baseball operate differently from any other sport, and the distinction matters. In the NFL, the spread adjusts to create a roughly 50-50 proposition. In MLB, the run line is almost always fixed at 1.5 runs. That fixed number means certain team profiles — dominant bullpens that protect late leads, explosive offences that blow games open — cover the run line at rates well above or below 50% for structural reasons, not just randomness.
A team that wins close games rarely might sport a strong moneyline record but a mediocre ATS record, because their victories often come by a single run. Conversely, a team with a middling moneyline record but a deep rotation and a dominant bullpen might cover -1.5 at a rate that makes them consistently profitable on the run line. The two records tell different stories, and bettors who only check win-loss records miss the ATS angle entirely.
Divisional patterns add another dimension. The AL East, for example, features lineups loaded with power hitters and ballparks that range from hitter-friendly (Yankee Stadium, Fenway Park) to more neutral. Intra-division games in the AL East tend to produce higher-scoring contests, which pushes run line cover rates in specific directions. When a division’s top team plays a bottom feeder within the same division, the margin of victory often exceeds 1.5 runs because the talent gap is amplified by familiarity — teams face each other 13 or more times per season, and the superior roster wins decisively more often than it wins narrowly.
I track ATS standings at three levels: overall, home-only, and away-only. The home-away split is critical because travel, time zones, and crowd factor all influence margin of victory. A team might be 55% ATS at home but 42% ATS on the road — and the composite number hides both extremes. For run line bettors, those splits are the difference between a good bet and a trap. The division-by-division ATS breakdown goes deeper into specific run line cover rates across both leagues.
One structural point that surprises newer bettors: ATS records in baseball have a shelf life. A team’s ATS performance from the first half of a season is only modestly predictive of their second-half ATS performance. Roster moves, injuries, and bullpen fatigue all reshape the profile. I reset my ATS ledger at the All-Star break and treat the second half as a fresh sample. The teams that covered consistently in April might be the ones getting burned by September, and vice versa.
Over/Under Trends by Division and Ballpark
A few years back, I noticed something odd while reviewing my totals records: games at Coors Field in April went under at a higher rate than games at Coors in July, despite the park’s reputation as a run-scoring haven. The altitude helps the ball carry year-round, but cold air is denser than warm air, and cold-weather games suppress the extra carry that makes Coors so extreme in summer. The sportsbooks knew this — the lines were set accordingly — but the betting public didn’t, and the public money hammered overs at Coors regardless of the month. That’s a totals trend driven by physics, not by narrative.
Over/under trends break down along two axes: team tendencies and environmental factors. Team tendencies are shaped by roster construction. A lineup full of contact hitters with a staff of ground-ball pitchers will trend toward unders more often than a team with power bats and fly-ball arms. When two under-trending teams meet in a pitcher-friendly park, the total is often set too high because the average game total across the league anchors the number upward.
Divisional matchups produce some of the most persistent totals trends. When teams face each other a dozen or more times per season, the pitching staffs gain familiarity with the opposing lineups. Familiarity typically suppresses offence — hitters may know what’s coming, but pitchers also know how to exploit each hitter’s weaknesses. The net effect is that late-season divisional games tend to go under more frequently than early-season divisional games or interleague contests. Rob Manfred himself has acknowledged that the sport is evolving rapidly, and these patterns shift as teams adjust their rosters and strategies mid-season — making it essential for bettors to reassess totals trends every few weeks rather than locking in a seasonal view.
I keep a rolling 30-game tracker for every team’s over/under rate, updated weekly. That window is long enough to smooth out random variance but short enough to capture genuine shifts in team profile — a deadline trade that adds a power bat, a pitching injury that forces a weaker arm into the rotation, or a bullpen that’s burned out from overuse. The 30-game window also corresponds roughly to the period over which sportsbooks adjust their team-specific totals models. If your data is fresher than theirs, you’re ahead.
Home Underdog Win Rates and ROI Breakdown
The single most reliable structural edge in MLB betting isn’t a metric or a model — it’s a situation. Home underdogs win at a 45.9% clip, crushing the road underdog rate of 33.1%. In a sport where favourites only win 58% to 62% of the time, home underdogs are competitive in nearly half their games. And because the public disproportionately bets favourites, the prices on home dogs tend to be inflated beyond what their actual win probability warrants.
The overall underdog win rate across the 2025 season landed at 38.5%. That number blends home and road underdogs into a single figure that obscures the real story. Road underdogs in hostile environments, facing ace pitchers, pull the composite number down. Home underdogs — playing in front of their crowd, sleeping in their own beds, throwing out a competent mid-rotation starter against a team on the back end of a road trip — win far more often than the line implies.
ROI on home underdogs varies by price range. The sweet spot, in my experience, falls between +110 and +160. Below +110, the price isn’t generous enough to compensate for the losing frequency. Above +160, you’re often backing a genuinely inferior team where the talent gap overwhelms the home-field advantage. Within that middle band, though, the long-term ROI has been consistently positive across multiple seasons.
Context sharpens the edge further. Teams on losing streaks of seven or more games playing as road underdogs carry a dismal 26-83 record with a -37% ROI. That data point works in two directions: avoid backing long-streak road dogs, and consider fading them when the public sympathy play or “due for a bounce” narrative inflates their line. The losing streak hasn’t created value — it’s destroyed it, because the underlying team quality is genuinely poor, and road conditions amplify the deficit.
Home underdogs coming off a loss perform differently from home underdogs coming off a win. The market slightly overadjusts after a home loss, making the next game’s underdog price marginally more generous than it should be. It’s a small edge — maybe two or three cents on the line — but over a full season of 162 games per team, those cents compound into a measurable return. Tracking this requires patience and volume, which is why it suits MLB’s daily schedule better than any other sport.
Losing Streak Trends: When to Fade and When to Follow
Losing streaks generate two opposing impulses in the public mind: “they’re due for a win” and “they’re in freefall, stay away.” Neither instinct is consistently correct. The data reveals a more specific answer: the location of the losing team determines whether the streak creates or destroys value.
Road teams on extended losing streaks are genuinely bad bets. The 26-83 record for teams with seven-plus consecutive losses playing away from home isn’t a fluke — it reflects the compounding effects of poor roster quality, eroded confidence, and the physical grind of travel. These teams aren’t “due” for anything except more losing. The public sometimes bets them at inflated underdog prices hoping for a bounce-back, but the bounce-back comes at home, not on the road.
Home teams on losing streaks present a different picture. The home-field advantage doesn’t evaporate because of a five-game skid. The starter still pitches in his usual ballpark, the lineup still benefits from familiar surroundings, and the crowd — even a frustrated one — provides a baseline energy that the road team doesn’t receive. When the sportsbook overreacts to the streak by pushing the home team’s underdog price beyond +140, value often appears. I don’t automatically back every home team on a losing streak, but I flag them and check whether the underlying metrics support a bounceback that the market hasn’t priced in.
The threshold I respect is five games. Below five consecutive losses, the streak isn’t long enough to have meaningfully moved the line beyond fair value. At five-plus losses, the public narrative kicks in, the price shifts, and the data starts to show a divergence between market perception and underlying quality. That’s the zone where trend-based bets become worth evaluating — not blindly following, but evaluating within the context of the matchup.
Mid-Season and September Stretch: When Trends Gain Predictive Power
The MLB season is a marathon disguised as a sprint. April looks like chaos — small samples, cold weather, rusty arms, new acquisitions still finding their rhythm. By mid-June, the picture starts to clarify. And from mid-July through September, the trends that have built over 90-plus games carry genuine predictive weight.
I treat the All-Star break as a statistical checkpoint. Any trend that has persisted through 80 to 85 games has passed a basic reliability test. A team that has gone over in 55% of its games through that volume probably has a structural reason — a weak bullpen, a high-powered offence, or a combination of park factor and roster construction that pushes run totals upward. That’s not a coincidence anymore. That’s identity.
The September stretch introduces a different dynamic. Contending teams tighten their rotations, ride their best relievers harder, and play with sharper urgency. Non-contending teams start resting veterans and integrating September call-ups — younger arms with electric stuff but limited experience. Both effects alter the betting landscape. Contenders playing at home in September against non-contenders tend to cover the run line at elevated rates because the talent gap widens when one side has everything to play for and the other has started planning for next year.
Weather interacts with the calendar in ways that matter for totals. Games in April and early May across northern venues — Chicago, Minnesota, New York, Boston — tend to run under because cold air suppresses ball carry and offences haven’t fully warmed up. By August, those same parks produce higher-scoring games as warm, humid air lets fly balls carry further and pitchers fatigue from six months of workload. A totals trend that formed in April at Wrigley Field tells you nothing about August at Wrigley Field. The calendar isn’t just context — it’s a variable that reshapes the entire run environment.
All 30 front offices now run analytics departments that track these same trends internally, adjusting lineups and strategies in real time. That means the market corrects faster in mid-season than in April. But it also means that when a trend persists despite the correction attempts, the underlying cause is strong enough to bet into. The trends that survive the All-Star break aren’t survivors by luck — they’re survivors because the structural cause hasn’t changed.
Separating Signal from Noise in MLB Trends
Here’s a test I run on every trend before I trust it with money: can I explain why it exists without referencing the trend itself? “The Astros have gone over in 8 of their last 10” isn’t a reason to bet the over. “The Astros have gone over in 8 of their last 10 because their bullpen has allowed a .380 wOBA over the past three weeks and their offence leads the league in hard-hit rate” — that’s a reason. The first statement is a pattern. The second is an explanation. Only explanations survive.
Sample size is the most commonly ignored factor in trend analysis. In the NFL, a 10-game ATS trend represents more than half a season and carries genuine weight. In MLB, a 10-game trend is 6% of the schedule. It’s noise dressed up as signal. The minimum sample I consider meaningful for any MLB betting trend is 30 games. Below that, the variance inherent in baseball — a sport where the best teams lose 60 times and the worst teams win 60 times — overwhelms any structural pattern.
Another trap: trend stacking. “Team X is 8-2 ATS on the road as an underdog on Tuesdays after a loss” isn’t analysis. It’s data mining. Every qualifier you add to a trend shrinks the sample and inflates the apparent hit rate by excluding the games that didn’t fit the narrative. If your trend requires three or more conditions to produce a strong record, you’ve likely carved the data into a shape that fits the past and predicts nothing about the future.
The trends I respect most are the simplest ones. Home underdog win rates. Season-long ATS splits by team. Over/under rates by park type. These are broad, well-sampled, and driven by identifiable structural factors. They don’t make for exciting social media posts, but they make for profitable long-term records. When you see a complex, multi-conditional trend being promoted as a lock, ask yourself: would this trend hold up if I removed one condition? If the answer is no, walk away. The trend isn’t robust — it’s fragile, and fragile trends break exactly when you need them not to.
One final discipline that took me years to adopt: separate your trend discovery from your bet execution. When I find a trend that looks promising, I don’t bet it the same day. I add it to a watch list, track it forward for two to three weeks, and see if it holds in real time against games I haven’t already seen the result for. This forward-testing eliminates the confirmation bias that makes every historical trend look like a goldmine. If the trend survives forward observation, it earns a spot in my active model. If it doesn’t, I delete it and move on. Trends are tools, not religions — and the best bettors treat them accordingly. For a deeper look at how advanced metrics validate or debunk the trends you find, the sabermetrics guide shows how to layer statistical confirmation onto any pattern.
MLB Betting Trends FAQ
How many games make an MLB betting trend statistically reliable?
A minimum of 30 games is needed for any MLB trend to carry meaningful predictive weight. Below that threshold, the natural variance of baseball — where even the best teams lose roughly 37% of their games — overwhelms structural patterns. For ATS and totals trends, 50-plus games provide a stronger foundation. Any trend built on fewer than 20 games should be treated as noise until a larger sample confirms it.
Do MLB ATS records carry over from one season to the next?
Only partially. A team’s ATS profile is tied to its roster construction, bullpen depth, and run-scoring patterns, all of which change between seasons through trades, free agency, and player development. Roughly 60% to 70% of a team’s ATS tendency persists into the following year if the core roster remains intact. Major offseason changes — a new ace, a rebuilt bullpen, or a lineup overhaul — reset the ATS baseline entirely.
Which MLB divisions produce the most profitable over/under trends?
Divisions with the widest range of ballpark environments tend to generate the most persistent totals trends. The AL East, with its mix of hitter-friendly and pitcher-friendly parks, and the NL West, featuring extremes from Coors Field to Oracle Park, consistently show the largest over/under divergences. Intra-division games in these groups amplify park effects because teams play each other frequently, compounding the environmental influence over the course of a season.
Why do road teams on long losing streaks perform so poorly against the spread?
Road teams with seven or more consecutive losses are typically dealing with compounding problems: weak roster quality, diminished confidence, and physical fatigue from travel. The road environment removes the comfort of home-field advantage, and the losing streak itself often reflects genuine talent deficiency rather than bad luck. Their 26-83 record with -37% ROI in these spots confirms that the losing streak is a symptom of underlying weakness, not a setup for a bounce-back.
Prepared by the mlb Betting Statistics editorial staff.